
SEO Reporting: How to Build a Report That Tracks Your Content Strategy
A useful SEO report gives every chart one question to answer. Here are eight guidelines for tracking content strategy without burying the decision.
Ralph Desmornes
Marketing Strategist and Consultant

A good SEO report can answer many questions: are rankings moving, where does demand sit, is the content earning clicks. What keeps it clear is giving each chart and each section one question to answer. A lot of SEO reports skip that and end up describing how the whole site is doing instead. This guide covers what a content strategy report should measure, how to lay it out, and the eight guidelines I follow to keep it accurate and focused.
What is SEO reporting?
Most people hear SEO reporting and picture a monthly export of rankings and traffic. That is the data. The reporting is what comes after: checking it against its source and presenting it so the reader can decide what to do next. A good SEO report ties rankings, visibility, traffic and content output to business goals. It is not a data dump.
Two things separate a report people use from one they ignore. The first is one clear question behind every chart and section. The second is numbers that survive a comparison with the source tool. The rest of this guide covers both.
What should SEO reporting measure for a content strategy?
SEO reporting for a content strategy should measure whether planned topics gain visibility, where keywords rank, which topics hold demand, whether published pages earn clicks, and whether the plan is on schedule. Each metric answers one question about the strategy. A metric that answers none of them does not belong in the report.
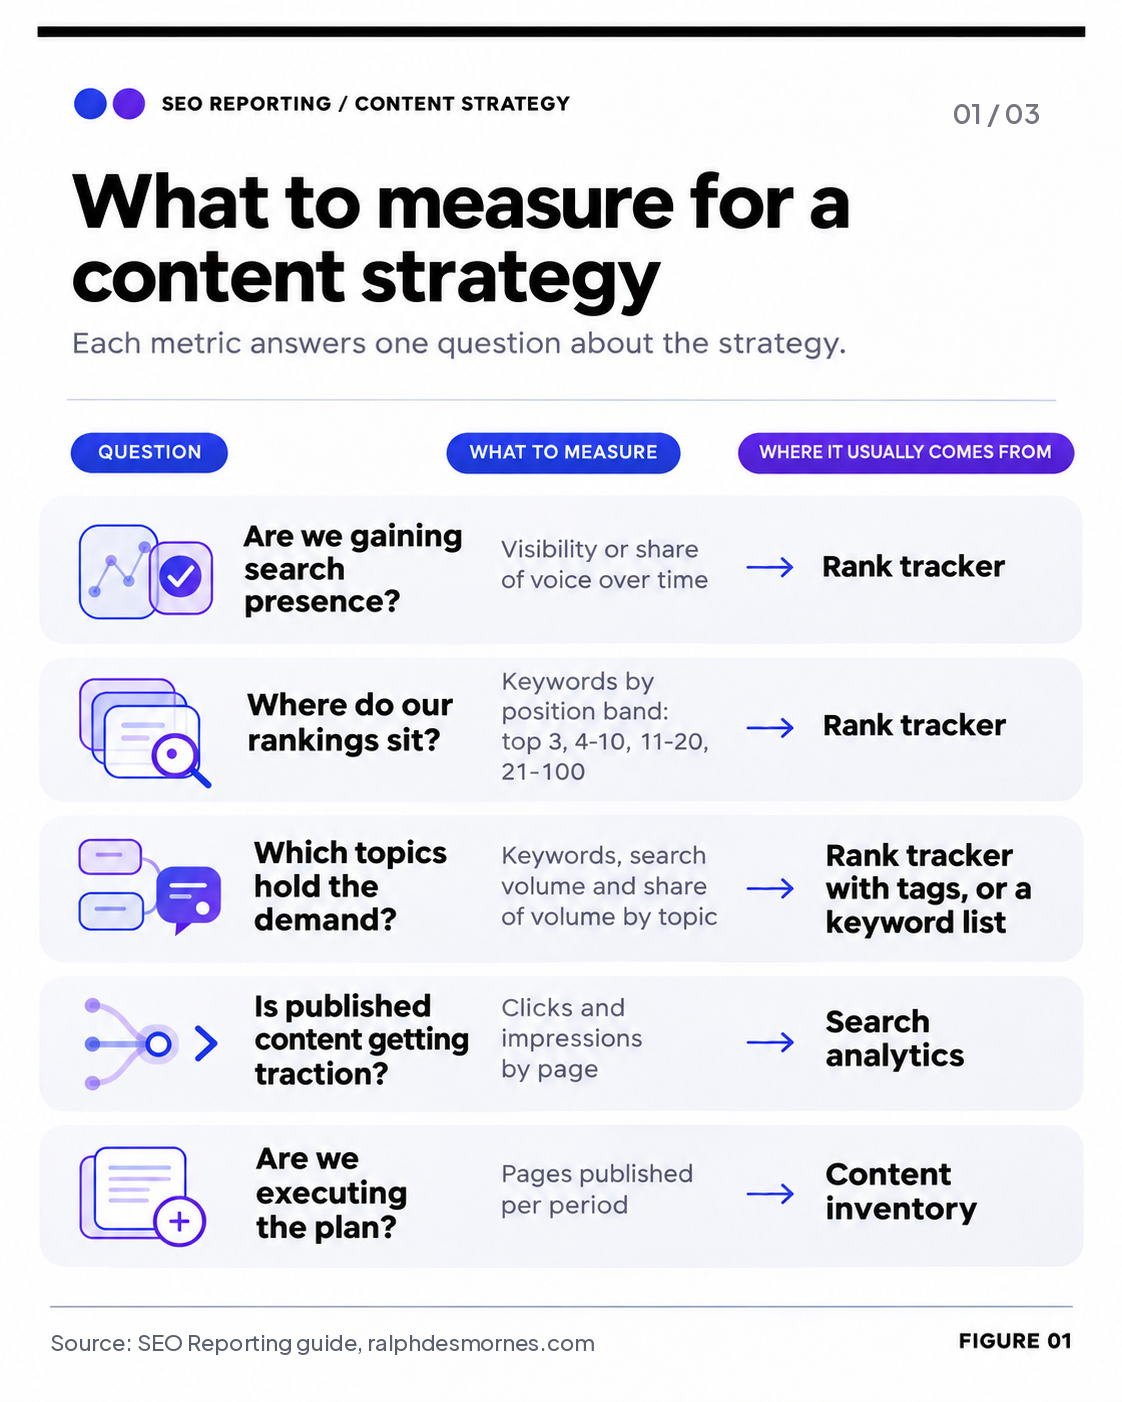
Text version of figure 1
| Question | What to measure | Where it usually comes from |
|---|---|---|
| Are we gaining search presence? | Visibility or share of voice over time | Rank tracker |
| Where do our rankings sit? | Keywords by position band: top 3, 4-10, 11-20, 21-100 | Rank tracker |
| Which topics hold the demand? | Keywords, search volume and share of volume by topic | Rank tracker with tags, or a keyword list |
| Is published content getting traction? | Clicks and impressions by page | Search analytics |
| Are we executing the plan? | Pages published per period | Content inventory |
Any tool that supplies the data will do. The questions stay the same. If you use Search Console for page-level data, its help page defines impressions, clicks and position.
What are the 8 guidelines for SEO reporting?
The eight guidelines below keep SEO reporting accurate, useful and defensible in front of a client. I follow them on every content strategy report I build.
Give every chart and section one question
A report can answer many questions, but each chart or section should answer just one. If you cannot name the question, cut the chart. A trend line with one day of data answers nothing, so lead with a headline number until history builds.
Report at the grain the source supports
Some metrics only exist at one level. A visibility score might be available for a whole domain or a group of keywords but not for a single keyword. Report each metric at the level the source supports, and do not estimate a finer level from a coarser one.
Let the data define the structure
Hand-built mappings go stale. Group by labels that live in the source, such as tags, so new groups appear on their own and nobody maintains a separate list.
Tie out before you publish
Compare every number to the source tool, row by row. Mismatches between a rank tracker and a dashboard usually trace back to a short list of causes: domain and folder settings, local pack settings and date ranges. Semrush lists these in its help center.
Cut what you cannot verify, and say so
I would rather send a smaller report that is accurate than a full one the client has to take on faith. If a metric cannot be tied to its source, remove it and add a one-line note naming what is missing and where to find it.
Plan for data age
New tracking has no history, so a trend chart starts as a single point. State the tracking start date on the page instead of drawing a trend through one day.
Test the controls
A date selector or filter only affects what is wired to it. A source with no date field ignores the date selector, and any range longer than the available history returns the same data. Defaults differ between tools too, so check what each chart is actually showing.
Recheck after every change
Edits to a source, date range or calculated field can shift totals without warning. Compare the totals with the source again after each change.
How should an SEO report be laid out?
Order the report the way the questions run. Headline numbers come first, then trend and rank distribution, then the topic breakdown, then execution. A reader gets the verdict on the first screen and the evidence below it.
- Scorecards at the top. Visibility, average position and keywords tracked.
- Trend and rank distribution side by side. One shows direction over time. The other shows where keywords sit now.
- A cluster table. One row per topic with keywords, volume and share of volume, plus a drill-down to the keywords inside it.
- Execution at the bottom. Content published and its performance by page.
How often should you send SEO reports, and to whom?
I recommend a short executive summary monthly and a detailed analyst view weekly or on demand. Executives need the verdict and the next action. Analysts need the underlying rows. One report rarely serves both.

Text version of figure 2
| Audience | Cadence | What they get |
|---|---|---|
| Executive or client sponsor | Monthly | Headline scorecards, trend, two or three wins and risks, next actions |
| Client marketing lead | Monthly | Everything above plus the rank distribution and cluster table |
| SEO team | Weekly or on demand | Keyword-level rows, source tie-outs, open issues |
With only a few weeks of tracking, a trend line shows little. Start with the headline numbers and the cluster breakdown, then add the trend as history builds.
What tools do you need for SEO reporting?
You need three layers: a rank tracker for positions and visibility, search analytics for clicks and impressions, and a reporting layer that combines them. The brand names matter less than whether each number ties back to its source.
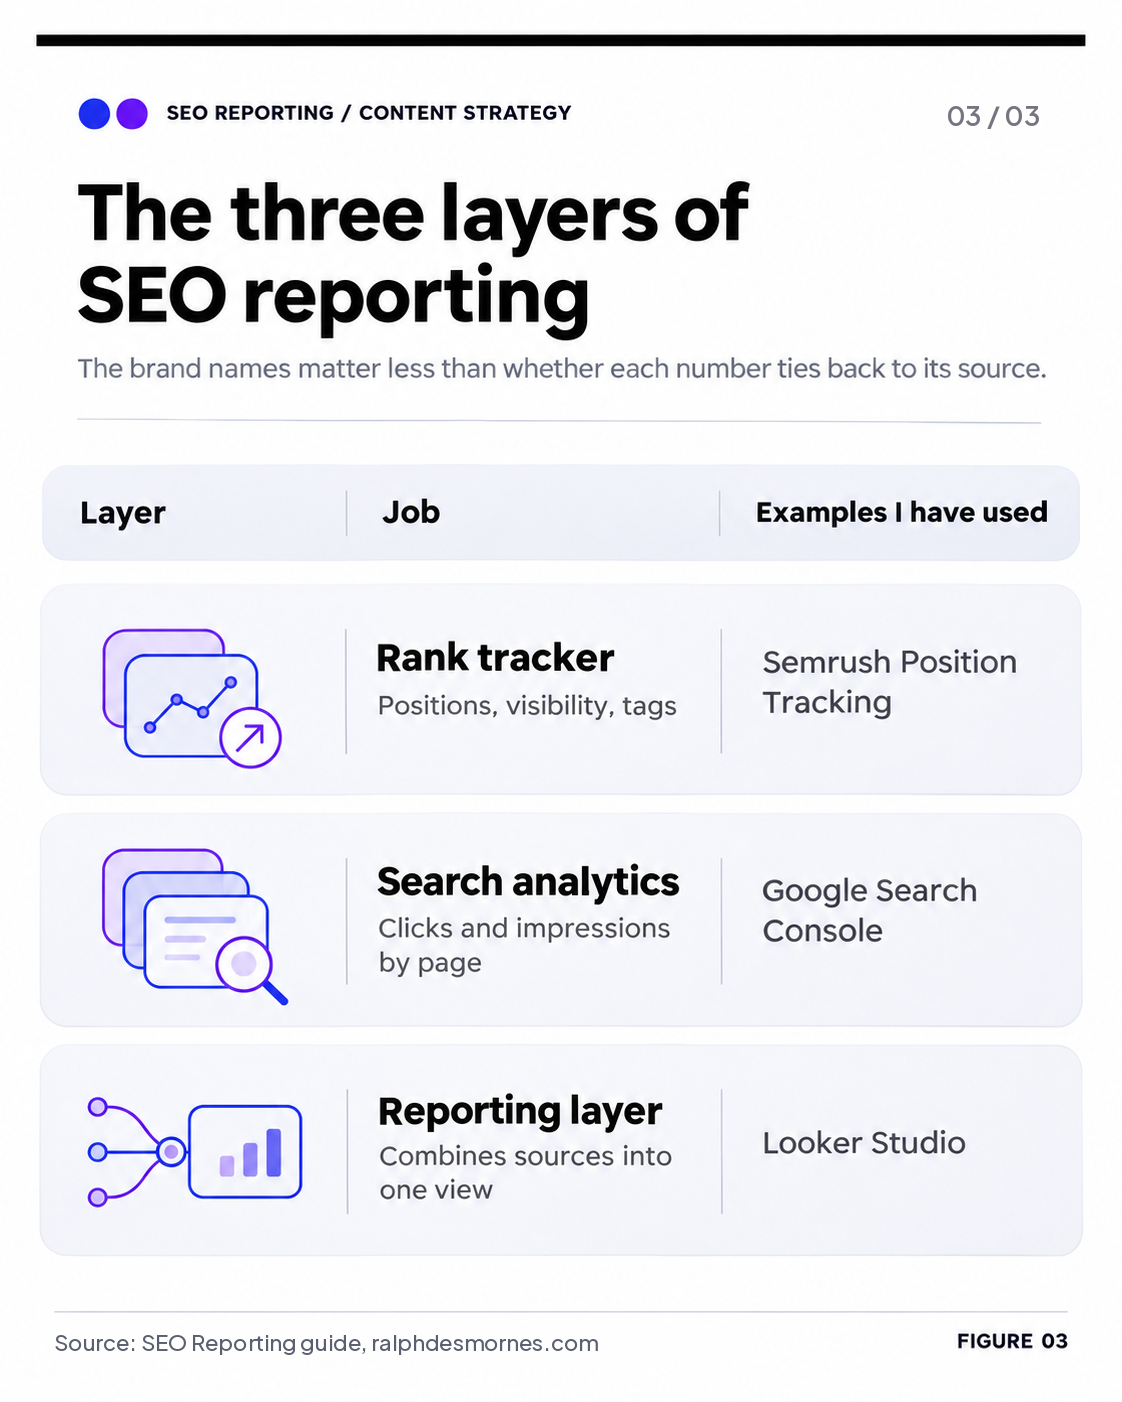
Text version of figure 3
| Layer | Job | Examples I have used |
|---|---|---|
| Rank tracker | Positions, visibility, tags | Semrush Position Tracking |
| Search analytics | Clicks and impressions by page | Google Search Console |
| Reporting layer | Combines sources into one view | Looker Studio |
A spreadsheet or a slide deck works for a small account. Automation helps once the report repeats. Tie out every automated number to its source before the report goes out.
AI answer engines are a separate source of visibility. I cover how brands earn citations there in How to Get Cited by AI: The AEO Playbook.
Why should SEO reporting track keyword clusters?
SEO reporting should track keywords in clusters because a site-wide number hides what happens inside each topic. Grouping keywords by topic lets you segment the data, spot patterns and see which parts of the strategy are working. Without the slice, you can win in one area and lose in another and never know.
A cluster is a group of keywords built around one topic. Each one gets its own row, so a change in the data points to a specific topic.
Clusters help in three ways:
- They segment the data. A total averages out wins and losses. A cluster view shows which topics are gaining and which are flat.
- They show patterns. Volume by cluster shows where search demand sits. If one topic holds half of your tracked volume and another holds a few percent, that gap shapes where the next articles go.
- They support diagnosis and long-term strategy. When a metric moves, the cluster shows which topic moved it. Over time, that guides what to publish, update or stop.
Report at the cluster level and you see the topic that is gaining and the topic that is slipping. A flat average hides both. Any tool that lets you tag or group keywords can support this view.
What should I check before I send an SEO report?
Check that every chart and section answers one question, every number ties to its source, and every control works. Use this list on every report.
- Each chart and section answers one question
- Every number is tied to the source
- Unverified metrics are removed, with a note on the page
- Groupings update from source labels
- Date range and filters are tested on every chart
- Data age is stated on the page
SEO reporting FAQ
What should an SEO report include?
An SEO report should include headline visibility and ranking numbers, a trend, a breakdown by topic, page-level traffic, and recommended next actions. Every metric should answer a question about the strategy. Leave out anything you cannot tie to its source.
How often should you send an SEO report?
Send executives a summary monthly. Give the SEO team a detailed view weekly or on demand. New tracking needs a few weeks of history before a trend line means anything.
What is the difference between an SEO report and an SEO audit?
An SEO report measures performance over time. An SEO audit examines a site’s technical and on-page health at one point in time and lists fixes. The report tells you whether results are moving. The audit tells you what to repair.
How do you automate an SEO report?
Connect the rank tracker and search analytics to a reporting tool so data refreshes on its own, then write the analysis by hand. Automation collects numbers and does not verify them. Compare each automated figure with its source before you send the report.
Next step
Audit your current SEO reporting against this checklist today. If a number does not tie to its source, fix it or cut it before your next client call.
Want a second set of eyes on your SEO reporting? Book a free discovery call or contact me.
Sources
I help B2B teams turn search and AI visibility into pipeline. Book a call and we will look at where you stand today.
Book a discovery call